Tutorial 4 of 7
Reports and charts
Intermediate 5 min
See where your time went per project, task, tag or client, over a week, a month or any range — as charts with a table behind each one — and download it as PDF, CSV or calendar file.
The Reports tab sums up the time of any range. Everything on it — totals, charts, the PDF, the share link — comes from the same calculation, so the numbers always agree.
Choose the range and the grouping
Range offers Today, Yesterday, This week, Last week, This month, Last month, Last 30 days, This year and Custom range with two date fields. The arrows next to it (or ← and →) step to the previous or next period of the same length. Group by sums the time per Project, Task, Tag or Client.
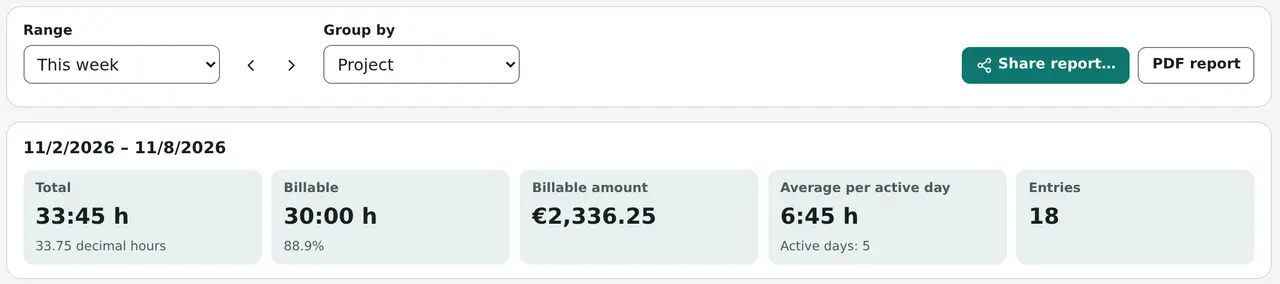
The cards show the Total (also as decimal hours for invoices), the Billable time and its share, the Billable amount if you set hourly rates, the Average per active day and the number of Entries.
Read the charts
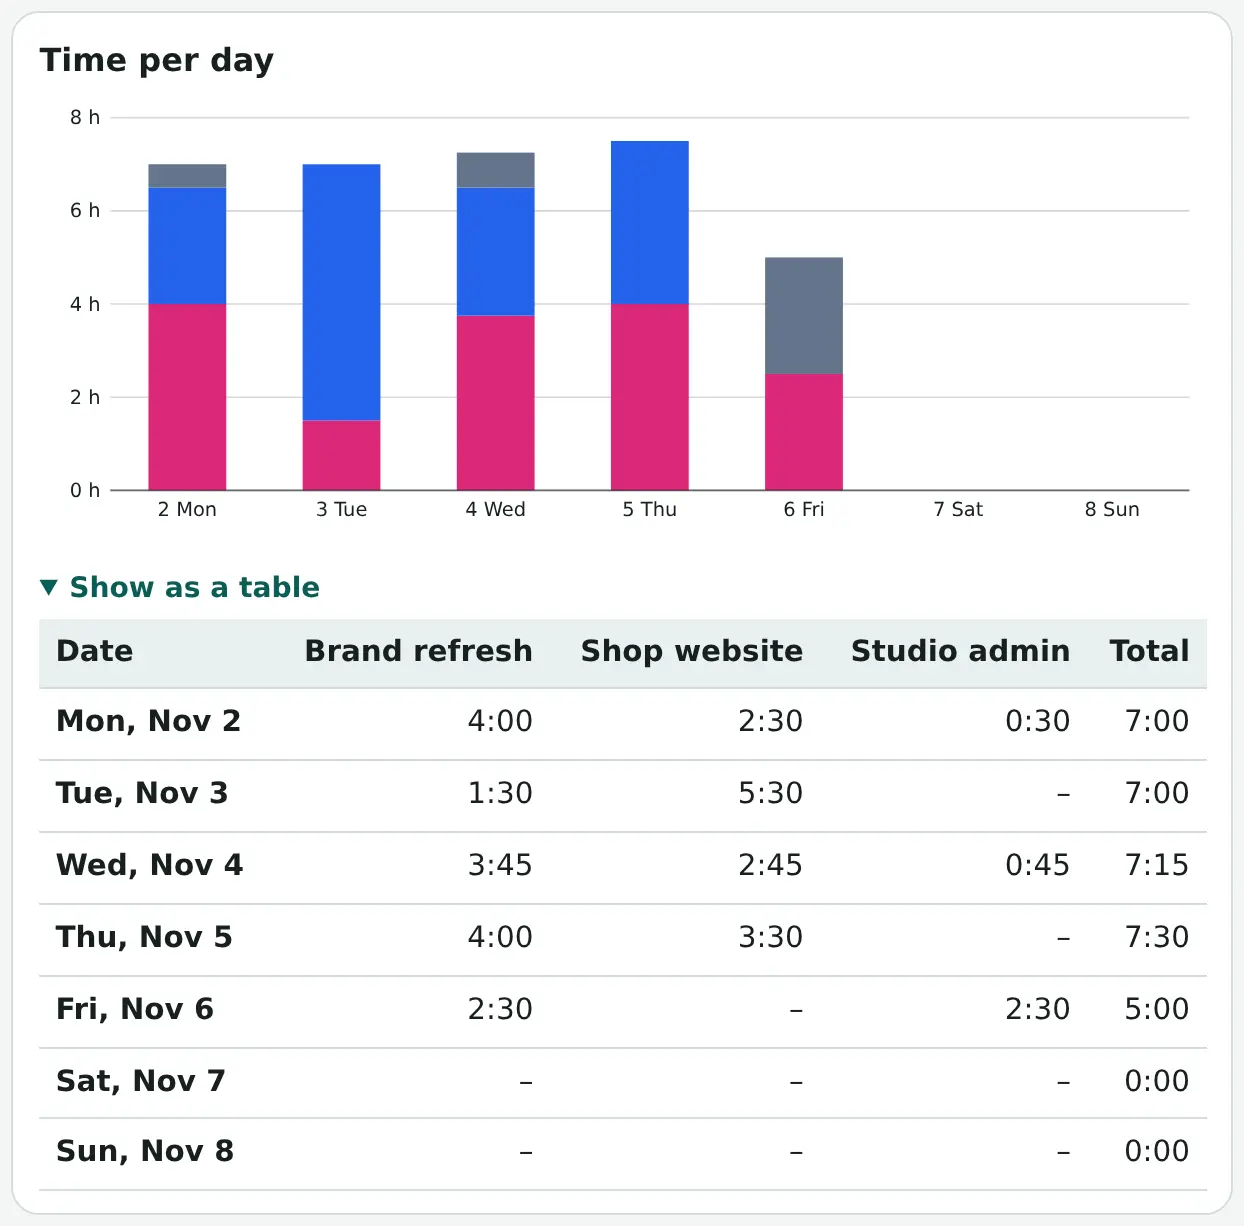
- Time per day stacks the groups per day, so you see both the day total and its mix.
- Share per … is a donut with each group's time and percentage.
- Trend draws the daily total with a dashed 7-day average. Set a Daily target in File → Settings… to add a target line.
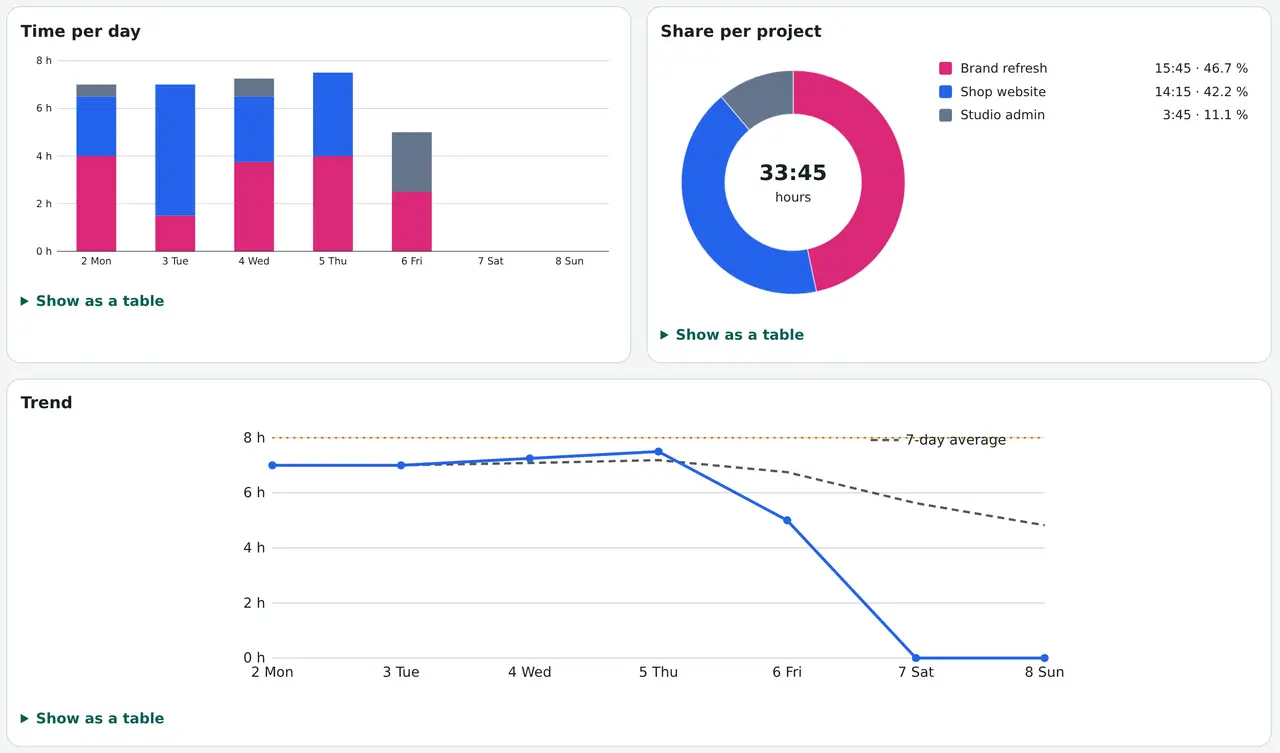
Under every chart, Show as a table opens the same numbers as a table — easier to read with a screen reader and handy to copy into a spreadsheet. Below the charts, a table lists every group with its time, share, billable time, amount and number of entries; ranges longer than a week add a table per ISO week.
Rounding and rates
In File → Settings…, Round each entry to rounds every entry to 5, 6, 10, 15, 30 or 60 minutes in reports and exports — To the nearest step or Always up, as many billing agreements ask. Your entries keep their exact times; only the report changes, and the amount card notes the rounding step.
Hourly rates go on a project, can be overridden per task, and the Default hourly rate fills the gaps. The currency follows your language unless you set a code such as EUR, USD or GBP.
Download it
PDF report makes a printable A4 report with the chart and the tables. The Export menu adds Report as JSON, All entries as CSV (opens in any spreadsheet), Entries as calendar file (.ics) for your calendar app, and the charts as SVG images.
Ready to try it?